Validating Blood-Pump CFD Models with the FDA Pump Benchmark
When it comes to developing blood-contacting medical devices such as ventricular assist devices (VADs), the ability to accurately predict flow and hemolysis inside rotating pumps is critical. After validating our computational approach on the simpler FDA Nozzle Benchmark, we moved on to the more challenging FDA Pump Benchmark — a full centrifugal blood pump model designed by the U.S. Food and Drug Administration for exactly this purpose.
Why the FDA Pump Benchmark Matters
Unlike the simple nozzle geometry, the FDA Pump Benchmark replicates the complex flow environment of a real pump: swirling, secondary flows, and blade tip clearances. The FDA’s open publication of both geometry and extensive experimental data makes it a gold standard for testing CFD-based hemolysis predictions before tackling proprietary or clinical devices.
Geometry and Setup
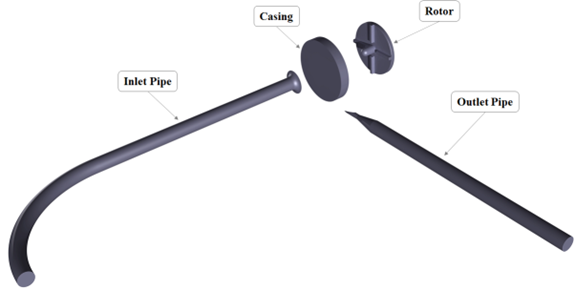
The FDA pump consists of:
– A four-blade radial impeller mounted on a cylindrical rotor,
– A 90° inlet elbow leading into the pump housing,
– A conical diffuser transitioning to a straight pipe outlet.
The rotor diameter is 52 mm; blade thickness and height are 3 mm; blade length is 18.5 mm. The outlet pipe’s inner diameter is 12 mm. These dimensions make the test case larger and easier to instrument than commercial blood pumps but still highly relevant to the flow physics encountered in VADs.
Experimental Campaigns
Two parallel test campaigns were run by the FDA and collaborating labs:
1. Hydrodynamic Testing (PIV):
Three independent laboratories performed particle image velocimetry (PIV) measurements using a Newtonian blood-analog fluid (sodium iodide, glycerin, and water). High-speed imaging at defined rotor positions produced time-averaged velocity fields in planes across the impeller and diffuser. Between 500 and 2500 image pairs per location were collected, giving an unprecedented database of flow information inside a rotating medical pump.
2. Hemolysis Testing:
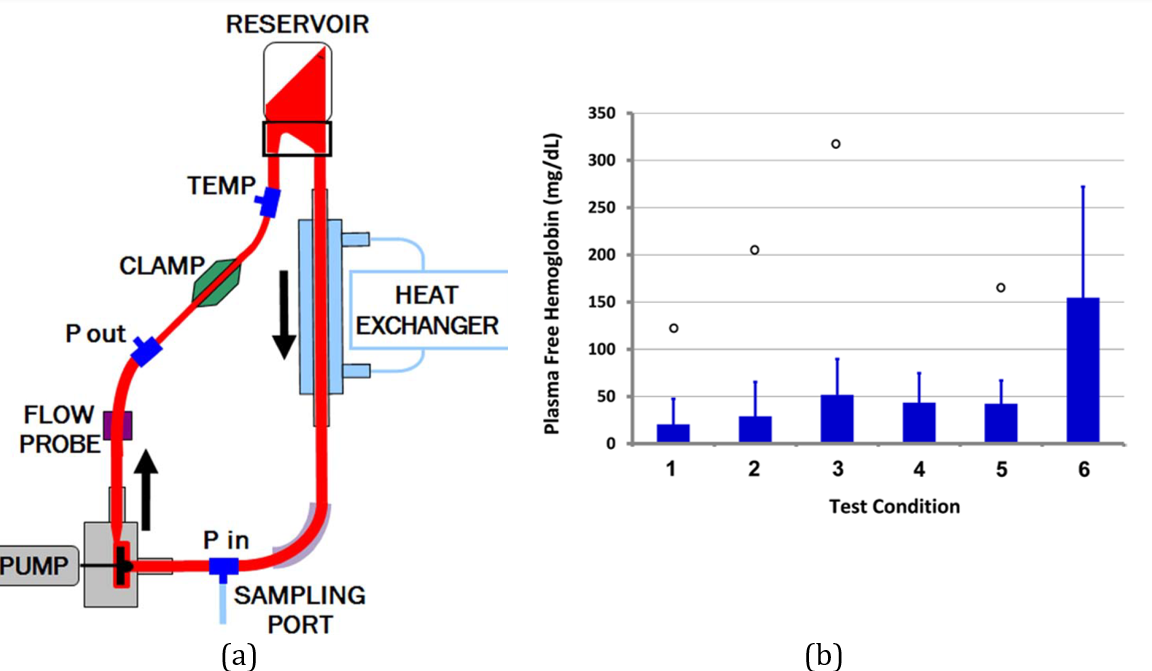
The same pump model was installed in a dedicated hemolysis loop filled with porcine blood at 25 °C. Flow rate and pressure sensors, a heat exchanger, and sampling ports allowed controlled operation at six different flow/rotational speed combinations (operating points). Each point was tested in duplicate using eight blood pools, producing 16 replicates. Blood samples were drawn every 40 minutes over two hours to measure plasma-free hemoglobin and compute the Modified Index of Hemolysis (MIH).
Our Numerical Methodology
Building on the lessons learned from the nozzle case, we simulated the FDA pump using:
– Transient Reynolds-Averaged Navier–Stokes (RANS) equations with the k-ω SST turbulence model, shown in earlier studies to give the best match to PIV data.
– Moving mesh approach to capture impeller rotation. Each time step corresponded to roughly 2° of rotor rotation (≈0.1 ms), and simulations covered at least 24 full rotations to achieve periodic flow.
– Power-law hemolysis model coupled directly to the flow solver. We applied several definitions of “equivalent stress,” including the updated Faghih & Sharp formulation with a tunable coefficient Cn.
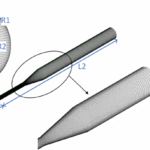
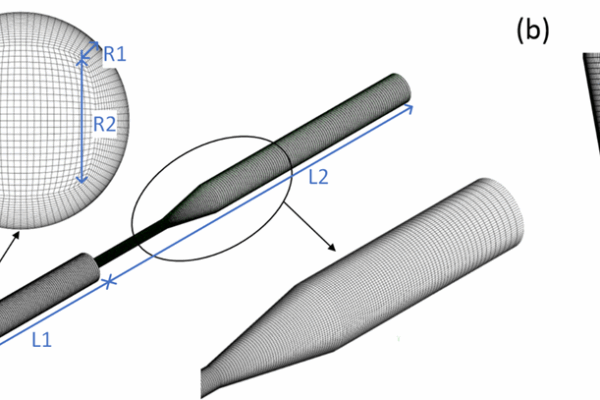
– Mesh refinement study: We generated unstructured tetrahedral meshes with prism layers near walls, from 2.1 to 16.2 million cells. By comparing pressure rise and MIH across meshes, we determined that beyond ~10 million cells the results converged; we used mesh M4 for the final simulations.

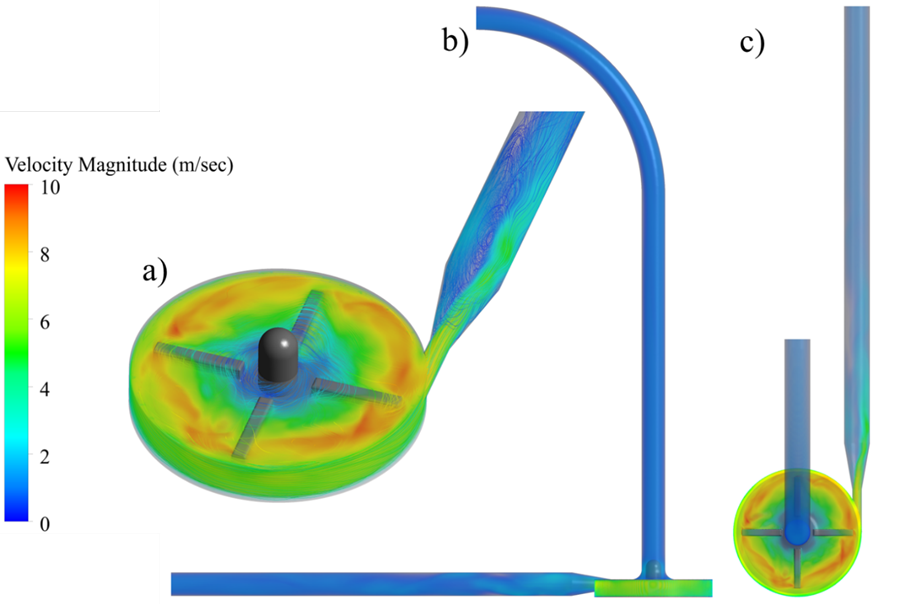
Results: Flow Field Validation
Our simulations captured both global and local flow features:
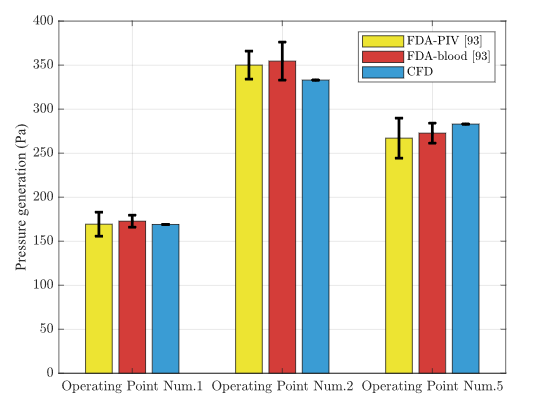
– Pressure Rise: The CFD-predicted pressure elevation at the three operating points agreed closely with FDA measurements.
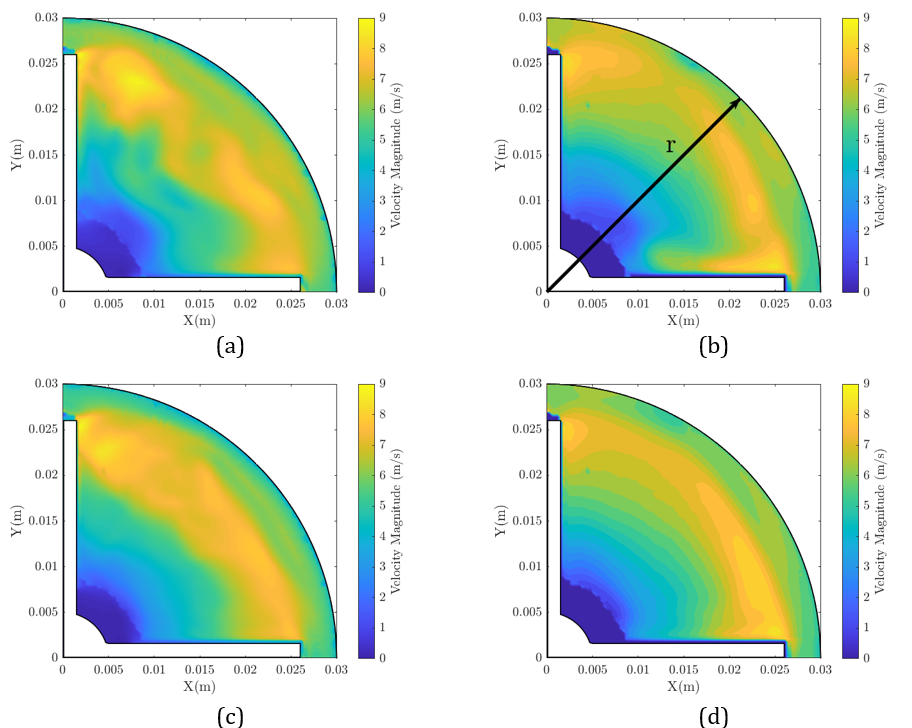
– Velocity Distributions: Cross-sectional velocity maps inside the impeller and diffuser matched the PIV contours, including blade-passage vortices and secondary flows. Errors in radial velocity profiles were within the experimental uncertainty.
This high level of agreement indicates that our turbulence modeling, moving mesh, and boundary conditions were correctly specified.
Results: Hemolysis Predictions
With validated flow fields, we computed the hemolysis index:
– Using the Faghih & Sharp definition with Cn between 18 and 27, the CFD-predicted MIH matched the experimental hemolysis data for all three operating points.
– Lower Cn values concentrated predicted hemolysis at blade tips and shroud clearances; higher values spread the damage region but still followed experimental trends.
– Volume renderings showed that critical hemolysis zones occur near the trailing edge of impeller blades and at diffuser shroud clearances — the same regions identified in the FDA’s own analysis.
What We Learned
This exercise demonstrated that:
– The k-ω SST turbulence model combined with fine meshes can reliably reproduce flow structures inside a rotating medical pump.
– The updated equivalent stress formulation improves the comparability of CFD hemolysis predictions to bench data, even if absolute numbers remain sensitive to model constants.
– Our validated CFD workflow can now be applied to real device geometries, allowing early detection of high-stress regions and informed design modifications before physical prototyping.
Impact on Device Development
By mastering both the FDA nozzle and pump benchmarks, we have built a robust in-house capability to predict hemolysis in complex blood-pump geometries. This accelerates design iterations, reduces reliance on animal testing, and ultimately leads to safer and more efficient medical devices.